Register now or log in to join your professional community.

Types of Energy Profile
What is an energy profile?
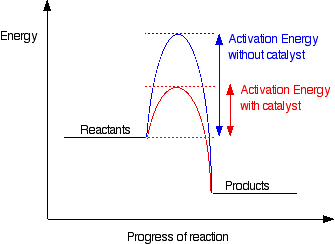
If you have done any work involving activation energy or catalysis, you will have come across diagrams like this:

This diagram shows that, overall, the reaction is exothermic. The products have a lower energy than the reactants, and so energy is released when the reaction happens.
It also shows that the molecules have to possess enough energy (called activation energy) to get the reactants over what we think of as the "activation energy barrier".
In this example of a reaction profile, you can see that a catalyst offers a route for the reaction to follow which needs less activation energy. That, of course, causes the reaction to happen faster.
Diagrams like this are described as energy profiles. In the diagram above, you can clearly see that you need an input of energy to get the reaction going. Once the activation energy barrier has been passed, you can also see that you get even more energy released, and so the reaction is overall exothermic.
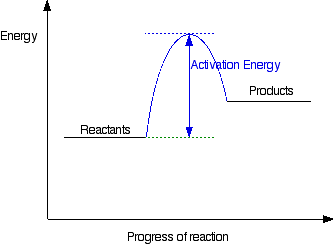
If you had an endothermic reaction, a simple energy profile for a non-catalysed reaction would look like this:

Unfortunately, for many reactions, the real shapes of the energy profiles are slightly different from these, and the rest of this page explores some simple differences. What matters is whether the reaction goes via a single transition state or an intermediate. We will look at these two different cases in some detail.

for an exothermic reaction, DeltaH0 or reaction is <0 and >0 for endothermic one. Catalyst modify activation energy and can be use for both


