Register now or log in to join your professional community.

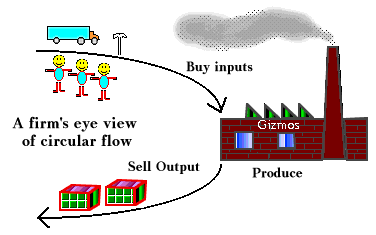
The business side of the circular flow diagram shows the three fundamental tasks of all firms in an exchange economy.1 First, a firm must obtain inputs. Inputs include raw materials, energy, machinery, office space, workers, and anything else needed to produce output. Second, the firm must combine or use inputs to produce output. Output may either be a tangible good such as a pair of shoes or an automobile, or a service such as a haircut or a medical checkup. Third, the firm must sell its output to someone else.

A firm that cannot do these three tasks well enough will not survive. When the automobile was developed in the early20th century, firms that made carriages died because they could no longer do task three, selling their output, well enough. Almost all baskets sold in the United States are imported. Baskets are handmade, and no firm in the United States can hire workers at wages low enough to be able to compete with wages that are acceptable in some other countries. Here is a case in which American firms (or firms in any industrialized nation) have difficulty coping with the first task. The development of the electronics industry is a case in which the second task has changed. New technology allows firms to combine inputs to produce goods that were not possible just a few years ago.
The economic theory of the firm is an analysis of how a firm must perform these three tasks to make a profit. Each task can be described in mathematical or graphical terms and each can be seen as a constraint or limitation that the firm faces.
Supply curves of resources describe the first task. They determine how much the firm must pay for various amounts of inputs. Each supply curve can be viewed as a boundary that tells the firm the minimum it can pay for any amount of a particular input. Points to the upper left of a supply curve are attainable, whereas those to the lower right are not. Sellers of resources impose this boundary on the firm when they require payment for the resources that the firm uses for production.
The production function describes the second task. It tells how much output the firm can produce from a set of inputs. As its name implies, the production function is often discussed as a relationship between inputs and output. (Mathematically, a function is a special sort of relationship.) However, it too can be discussed as a boundary, one that technology imposes on the firm. It shows the maximum that can be produced with any combination of resources. Less than this maximum can be produced--one can always get nothing for something.
The demand curve for output describes the third task. It depends on people's wants or preferences and tells how much the firm can charge for output. The demand curve can be viewed from a number of perspectives: as a relationship between price and quantity buyers will buy, as a locus of points of consumer equilibrium, as a measure of marginal benefit to the buyer, or as a boundary. This last view, that the demand curve represents a boundary that buyers impose on the seller, is one that is most useful when developing the theory of the firm. The demand curve limits the amount that sellers can sell at each price. Points to the left of the demand curve are attainable, while those to the right are not.
The remainder of this group of readings takes a closer look at these three constraints. The material is somewhat technical, but it contains much of the core of microeconomics. We begin by looking more closely at the production function.


